Computer Algebra Systems
A computer algebra system, or CAS, is a mathematics engine that performs the symbolic computations fundamental to algebra, trigonometry, and calculus. Recent versions of Scientific WorkPlace® and Scientific Notebook® (after Version 4.1 Build 2347) include the kernel to the computer algebra system MuPAD®.
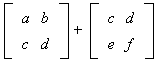
With MuPAD 5®, you can evaluate, factor, combine, expand, and simplify terms and expressions that contain integers, fractions, and real and complex numbers, as required in simple arithmetic and algebra. You can also evaluate integrals and derivatives, perform matrix and vector operations, find standard deviations, and perform many other more complex computations involved in calculus, linear algebra, differential equations, and statistics. Additionally, you can create 2D and 3D plots of polynomials, trigonometric functions, and exponentials, and you can create and explore animated 2D and 3D plots.
Features and Capabilities of MuPAD
We have created an interface to the MuPAD kernel to make it easy to use with Scientific WorkPlace and Scientific Notebook. In addition, the system accepts input and creates output using natural mathematical notation, the basis for our scientific word processors. Performing computations in Scientific WorkPlace and Scientific Notebook is easy.
Computational Functions. Scientific WorkPlace and Scientific Notebook provide a wide range of the graphic, numeric, and symbolic computational functions available with MuPAD. The programs provide ample functionality for both simple and sophisticated mathematical computations involving calculus, ODE, matrix manipulations, statistics, linear algebra, and 2D and 3D plots. Also, you can access additional functions available to MuPAD—even if they don't appear as items on the Compute menu—with the Define MuPAD Name menu item.
Animated Plots. With MuPAD, you can create a variety of animated plots: animated 2D plots in polar coordinates, animated 2D and 3D plots in rectangular coordinates, animated 2D and 3D implicit plots, and animated 3D tube plots in cylindrical and spherical coordinates and vector fields. You can rotate, move, zoom in and out, and fly through 3D plots.
User-defined Functions. With MuPAD, you can create user-defined functions (.mu files) with an ASCII editor, even if you don't have access to a full MuPAD installation. The files are easy to manipulate and are powerful tools for users interested in programming. Working in a Scientific WorkPlace or Scientific Notebook document, you call the function with the Define MuPAD Name command.
Available Functions. While Scientific WorkPlace and Scientific Notebook provide many functions available with MuPAD, not all capabilities are included. Programming packages, certain plot types and options), and manipulation of the position of highlights and shadows in 3D plots aren't available. Scientific Notebook doesn't have 3D implicit plotting with either CAS. Additionally, some limitations exist regarding the placement of text on plots and the use of different types of plots on the same graph. Iteration and condition commands (such as if, elif, else, fi, for, while, do, and od) aren't available.
To learn more about MuPAD, visit the MathWorks website.
Examples
You can use MuPAD to solve the following kinds of problems in Scientific WorkPlace and Scientific Notebook. Roll the mouse over the mathematics to see the solution to each problem.
Arithmetic
Evaluate


Factor

Evaluate


Evaluate


Evaluate Numerically


Simplify

Factor


Algebra
Expand

Factor

Solve
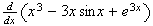
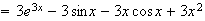
Calculus
Evaluate

Evaluate
Evaluate
Evaluate
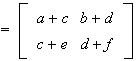
Evaluate the Determinant of

Statistics
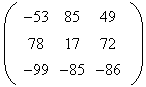
Determine the Mean of

Determine the Standard Deviation of


Plots and Animated Plots
You can create plots like these with Scientific WorkPlace and Scientific Notebook:
2D Plots
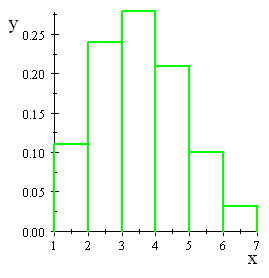
Plot 2D + Rectangular:
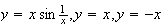
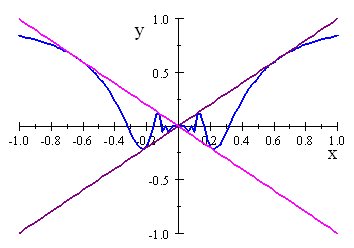
Plot 2D + Rectangular
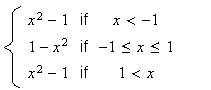
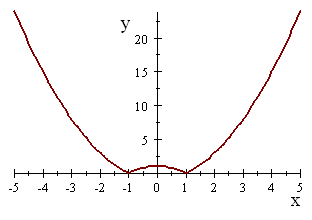
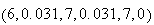
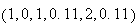
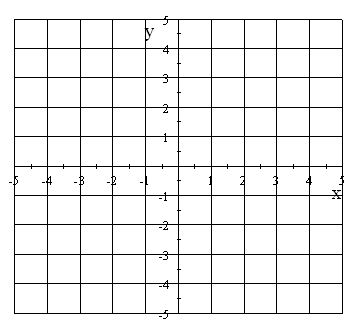
Enter, select, and drag to a 2D Rectangular plot each of the following:

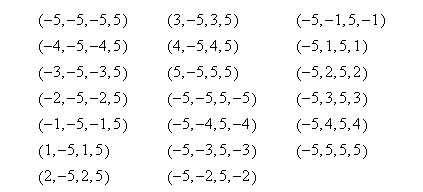
You can create a grid using point plots. Enter, select with the mouse, and drag each of the following to the frame:
Animated 2D Plots
• Animated 2D Rectangular Plot
Plot 2D Animated + Rectangular: 
Enter, select, and drag to the frame each of the following:
 ,
, 
3D Plots
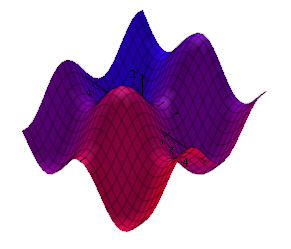
• 3D Rectangular Plots
Plot 3D + Rectangular:

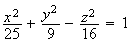
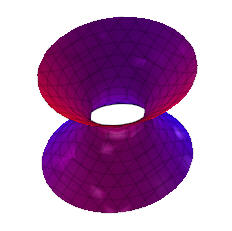
• 3D Implicit Plots
Plot 3D + Implicit:
Animated 3D Plots
• Animated 3D Rectangular Plot
Plot 3D Animated + Rectangular